Step-by-step to a Data Scientist >
Blog >
Python >
SunPy – Planet Positions in the Solar System
SunPy is a useful python library to access solar physics data. Therefore, we can easily visualize planet positions in the solar system by utilizing SunPy.
In this post, we will quickly see how to visualize the orbits of specified planets in a specified time series.
This post assumes the use of a Jupyter notebook.
The full code link of Google Colab
Install SunPy and Astropy
Before analysis, we have to install SunPy if you did not install it yet. We can easily install it with a pip command. If you use an anaconda environment, please use conda commands.
In this post, the version of SunPy is 3.1.8.
In addition to SunPy, we use data structures of Astoropy, a common-core python package for Astronomy.
In this post, the version of Astropy is 4.3.1.
Import libraries
First, we import the necessary libraries.
import matplotlib.pyplot as plt
import numpy as np
import pandas as pd

from astropy.coordinates import SkyCoord
from astropy.time import Time
from sunpy.coordinates import get_body_heliographic_stonyhurst
Quick Try
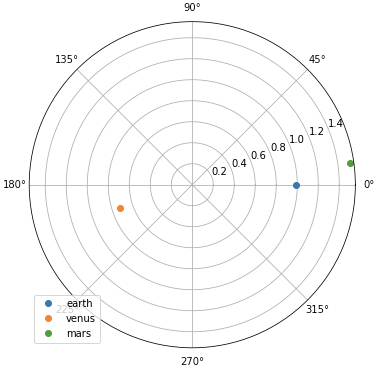
Let’s try SunPy with a quick view. We have to specify the planets and the time series as the “Time” type of Astropy. Then, we can get each coordinate by using the function “get_body_heliographic_stonyhurst()” of SunPy.
Note that the coordinate system is NOT the cartesian coordinate. We can get them as latitude, longitude, and radius. And, the units are degree and AU. Au is the distance unit, where 1 AU is the distance between Earth and Sun().
obstime = Time('2022-11-22T07:54:00.005')
planet_list = ['earth', 'venus', 'mars']
planet_coord = [get_body_heliographic_stonyhurst(this_planet, time=obstime) for this_planet in planet_list]
We can visualize them as follows.
fig = plt.figure(figsize=(6, 6))
ax1 = plt.subplot(1, 1, 1, projection='polar')
for this_planet, this_coord in zip(planet_list, planet_coord):
    plt.plot(np.deg2rad(this_coord.lon), this_coord.radius, 'o', label=this_planet)
plt.legend(loc='lower left')
plt.show()
Obtain the Orbit Information of the Planets in the Solar System
We will prepare the practical functions to visualize the orbits of specified planets in a specified time series.
First, we define a function to get a list of coordinate information instances for a specified planet at a specified time.
def get_planet_coord_list(timestamp, planet_list):
    """
    Get a list of coordinate information instances
    for a specified planet at a specified time
    """
    # convert into the Time type of astropy
    timestamp = Time(timestamp)

    # get a coordinate of a specified planet
    planet_coord_list = [get_body_heliographic_stonyhurst(_planet, time=timestamp) for _planet in planet_list]

    return planet_coord_list
Second, we define a function to get coordinates of specified time and planets. In this function, we use the function get_planet_coord_list() defined above.
def get_planet_coord(timestamp, planet_list):
    """
    Get coordinates of specified time and planet

    Return: dict
        key(str): planet name
        value(dict): latitude(deg), longitude(deg), radius(AU)
            key: 'lon', 'lat', 'radius'
    """
    # a list of coordinate information instances
    # for a specified planet at a specified time
    _planet_coord_list = get_planet_coord_list(timestamp, planet_list)

    dict_planet_coord = {}
    for _planet, _coord in zip(planet_list, _planet_coord_list):
        # latitude(deg), longitude(deg), radius(AU)
        lon, lat, radius = _coord.lon, _coord.lat, _coord.radius
        # dict_planet_coord[_planet] = [lon, lat, radius]
        dict_planet_coord[_planet] = {'lon':lon, 'lat':lat, 'radius':radius}

    return dict_planet_coord
Third, we define a function to get the coordinates of a specified planet in a specified time series. By obtaining the coordinates for the time series, we can plot the orbit at the specified period. And, in this function, we use the function get_planet_coord() defined above.
def get_planet_coord_timeseries(timeseries, planet_list):
    """
    Get coordinates of a specified planet in a specified time series
    """
    # initialization
    dict_planet_coord_timeseries = {}
    for _planet in planet_list:
        dict_planet_coord_timeseries[_planet] = {'lon':[], 'lat':[], 'radius':[]}

    # Obtain coordinates of each planet in time series
    for _timestamp in timeseries:
        """
        Coordinates of the specified planet at the specified time

        key(str): planet name
        value(dict): latitude(deg), longitude(deg), radius(AU)
            key: 'lon', 'lat', 'radius'
        """
        dict_planet_coord = get_planet_coord(_timestamp, planet_list)
        for _planet in planet_list:
            for _key in ['lon', 'lat', 'radius']:
                dict_planet_coord_timeseries[_planet][_key].append(np.array(dict_planet_coord[_planet][_key]))

    # Convert list into ndarray
    for _planet in planet_list:
        for _key in ['lon', 'lat', 'radius']:
            dict_planet_coord_timeseries[_planet][_key] = np.array(dict_planet_coord_timeseries[_planet][_key])

    return dict_planet_coord_timeseries
Now all information on planetary orbits can be obtained. Now let’s actually plot the orbits of the planets.
Visualization of the Orbits of the Planets in the Solar System
To visualize the planetary orbits more easily, we will define the plot function. The argument of this function is the return of the function get_planet_coord_timeseries() define above.
def plot_planet_position(dict_planet_coord_timeseries):
    fig = plt.figure(figsize=(8, 8))
    ax = plt.subplot(1, 1, 1, projection='polar')
    for _planet in dict_planet_coord_timeseries.keys():
        # longitude(deg), radius(AU)
        lon = np.deg2rad(dict_planet_coord_timeseries[_planet]['lon'])
        radius = dict_planet_coord_timeseries[_planet]['radius']
        # plot
        plt.plot(lon, radius, label=_planet, linewidth=2)
        plt.scatter(lon[0], radius[0], color='black', s=40)  # initial point
        plt.scatter(lon[-1], radius[-1], color='red', s=40)  # final point
    plt.legend()
    plt.show()
    plt.close(fig)
Then, let’s plot the orbits!
Using the functions you have defined so far, you can easily draw orbits for a given planet and period of time. The information to be pre-specified is the period of the target data (start and end) and the planets of the solar system.
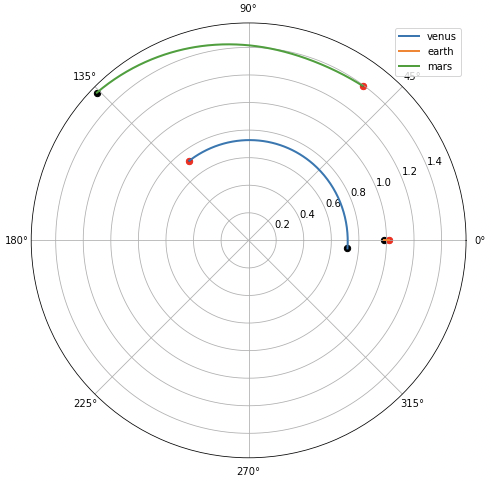
First, let’s specify a near-Earth planet. Set the period appropriately. The author encourages readers to try changing it in various ways.
start, end = '2022-01-01', '2022-08-01'
planet_list = ['venus', 'earth', 'mars']

timeseries = pd.date_range(start, end, freq='D')
dict_planet_coord_timeseries = get_planet_coord_timeseries(timeseries, planet_list)
plot_planet_position(dict_planet_coord_timeseries)
Note that the graph is in a coordinate system with the earth as the stationary system in the angular direction. Therefore, the position of the earth appears to be motionless, except in the radial direction. The change of the earth in the radial direction is due to the fact that the Earth’s orbit is not strictly circular, but elliptical.
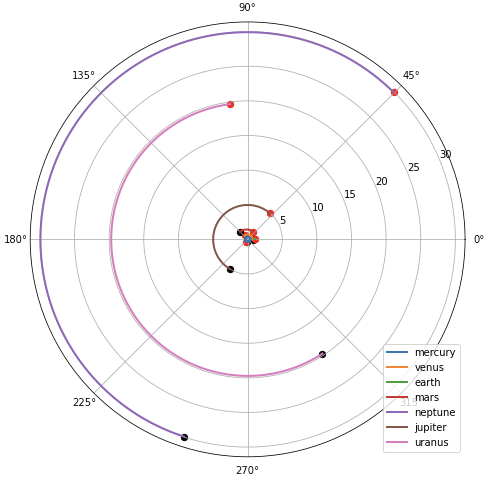
Next, we will include planets far from Earth.
planet_list = ['mercury', 'venus', 'earth', 'mars', 'neptune', 'jupiter', 'uranus']
dict_planet_coord_timeseries = get_planet_coord_timeseries(timeseries, planet_list)

plot_planet_position(dict_planet_coord_timeseries)
Planetary orbits around the Earth can be seen to be quite dense. In this way, the structure of the solar system can be visually confirmed.
Summary
We have seen how to visualize the orbits of specified planets in a specified time series by SunPy. With SunPy, any Python user can check the orbits of the planets of the solar system.
The author hopes this blog helps readers a little.