Skip to content

Step-by-step to a Data Scientist

Introduction of basic skills for a Data Scientist

  • Home
  • Blog
  • Books
  • About
  • Contact
  • Privacy Policy
Posted on March 27, 2022August 16, 2022 by caro_caro

Demo of a Web App. for 3D Scatter Plot

Step-by-step to a Data Scientist > Blog > streamlit > Demo of a Web App. for 3D Scatter Plot

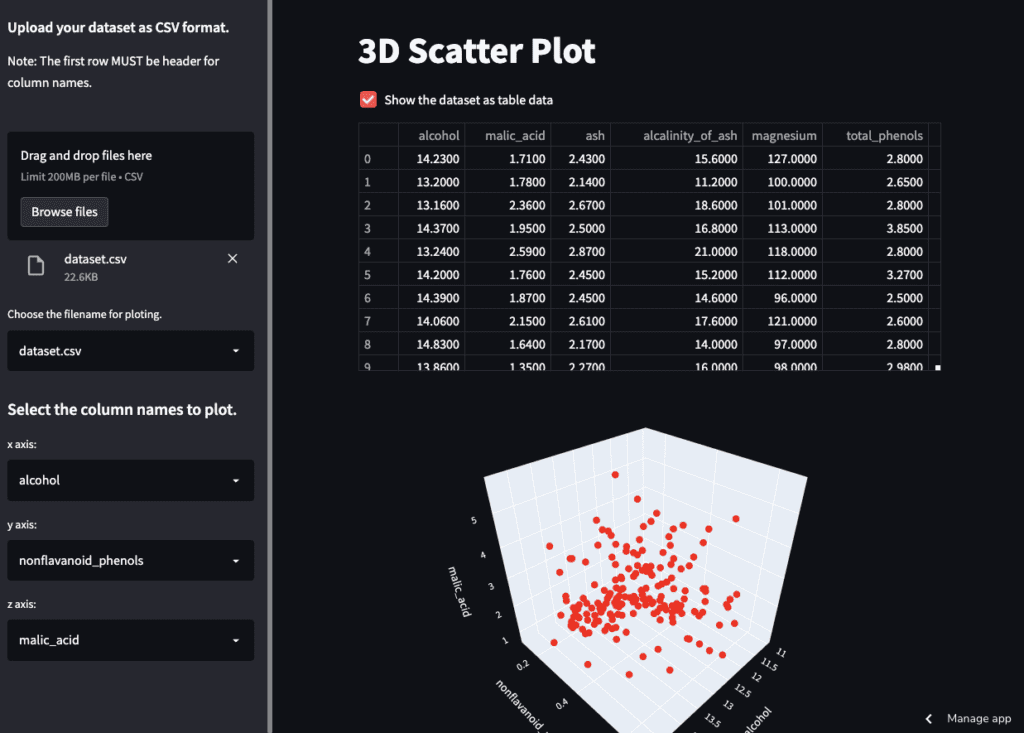
Now, the web app for the 3D-scatter plot has been released.

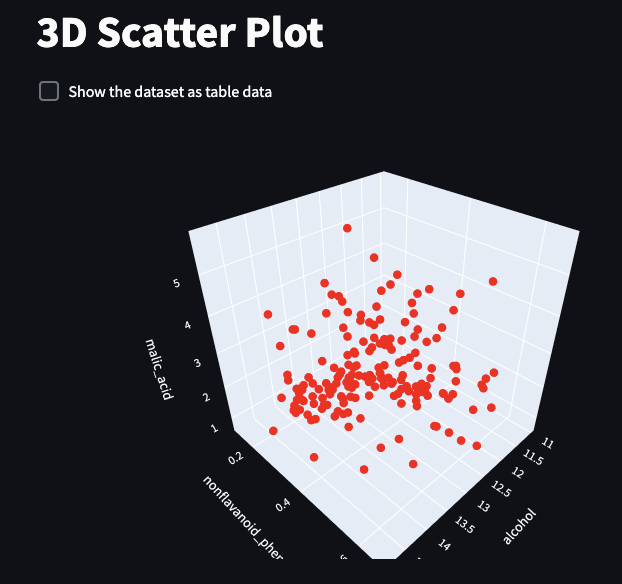
We can v plot the CSV-format dataset as the following image.

URL of the web app.

https://caron14-streamlit-3d-plot-by-plotly-plot3d-on-streamlit-bzo7i5.streamlitapp.com/

GitHub Repo. for the full Code

https://github.com/caron14/streamlit_3d_plot_by_plotly

Image for the Web App.

Categoriesstreamlit

Post navigation

Previous PostPrevious Weekly Article News #26
Next PostNext Weekly Article News #27

Recent Comments

    Archives

    • April 2025
    • April 2023
    • January 2023
    • December 2022
    • November 2022
    • October 2022
    • September 2022
    • August 2022
    • July 2022
    • June 2022
    • May 2022
    • March 2022
    • February 2022
    • January 2022
    • November 2021
    • October 2021
    • September 2021
    • August 2021
    • July 2021
    • June 2021
    • May 2021
    • April 2021
    • March 2021
    • February 2021
    • January 2021
    • December 2020
    • November 2020
    • October 2020
    • September 2020

    Categories

    • algorithms
    • Data Science
    • Deep Learning
    • developer skills
    • for beginner
    • GPy
    • Machine Learning
    • NumPy
    • Pandas
    • PyCaret
    • Python
    • step-by-step guide
    • streamlit
    • Weekly Article News

    Disclaimer

    Although every effort has been made to ensure that the content posted on this site is complete, we do not guarantee all the content.

    Copyright

    ©2020 –  Step-by-step to a Data Scientist. All Rights Reserved.

    Privacy Policy Proudly powered by WordPress